Homes are probably not as unaffordable as you think
October 3, 2022


It's often said that housing has become outrageously expensive. Indeed, home prices seem expensive, especially when you consider how much higher home prices are now than they were during the home price bubble of 2007/2008 (see Figure 1). But I don't believe that homes really are so expensive, at least not when compared to the homes our parents and grandparents lived in.
The median home price in Q1 1980 was $63,700, and was $438,000 in Q3 2022, 588% more than it was in 1980. In contrast, the consumer price index (CPI), grew from 78 in 1980 to 297.9 in October 2022, 282% more than its 1980 levels. So home prices have outpaced inflation 109%. But homes are bigger now[1]. The median new home in 1980 had 1,570 sqft, whereas the median new home in 2022 had 2,383 sqft, 52% more than the size of the median home in 1980. Therefore, while home prices are 588% higher than their 1980 levels, home price per square foot is only 353% higher than its 1980 level, outpacing inflation by only 25%[2, 3, 4][a].
In contrast, the S&P 500 grew 782% between January 1980 and October 2022. Ignoring dividends and returns on reinvested dividends, it outpaced inflation by 177%. Annual healthcare spending per capita in 1980 was about $1,100. In 2022 it was $13,500, outpacing inflation by 300%[5]. Average college tuition, at $738 in 1980 and $9,596 in 2022, outpaced inflation by 326%. That said, while healthcare spending and college tuition have outpaced home-price growth, we probably feel home price growth more acutely because the absolute dollar amount is much larger[6]. From 1980 to 2022 median home price grew by about $374,000 while healthcare spending has grown by $12400 and college tuition by about $8900.
Although homes have become more expensive on a per square foot basis, median household income[7] has outpaced inflation over the last 40 years, sitting at $74,580 today, 321% higher than it was in 1980, at $17,710. So while home price per square foot has outpaced inflation by 25% since 1980, it has only outpaced median income growth by 10%[8]. I'm going to call this the home purchase pain index, and say that it's 10% more painful (on a per square foot basis) for the median individual to buy a home in 2022 than it was 42 years ago. Said another way, the home purchase pain index has grown annually at a rate of 0.23% since 1980.
By way of analogy, a 10% spike in the price of bread in a poor country would probably meet the threshold of a crisis, but a 10% rise in the relative price of a home over more than 40 years probably doesn't. Homes aren't commodities though, and you certainly can't purchase individual square feet of a home, so this isn't a fair analogy. The increase in home prices is annoying and a reflection of structural issues, and on the margins it pushes certain people out of home ownership entirely. So it's certainly a problem. Frankly, homes should become less difficult to acquire with time[9]. But most homebuyers view a home as a financial investment, so they expect home values to grow at least at the rate of inflation, and ideally much quicker. Plus, restrictive zoning in most jurisdictions makes it illegal to build dense housing that benefits from economies of scale, but that's a discussion for another time.
Coming back to the argument at hand, there's also been a large rural to urban migration trend since 1980. The US urban population has grown 73% since 1980, from 223M to 338M, while the rural population has shrunk from 60M to 56M. One study mapping development patterns found that US urban area growth grew only 20% between 1985 and 2015. I couldn't find a dataset for the full 1980-2022 time period, but extrapolating the 1985-2015 data set on both ends results in a roughly 28% urban area growth from 1980-2022. Obviously, extrapolating data doesn't tell the real story, but my goal here is to be directionally correct, not perfectly accurate. Even doubling the 28% I've arrived at, urban area growth from 1980 to 2022 would still be less than the 73% growth in urban populations.
Perhaps in response to this trend, average lot size[10] has dropped 10%. There's also been a very slight shift towards condo ownership. According to the US Census Bureau's American Housing Survey, single-family attached homes shifted from 3.8% to 5.4% of all owner-occupied units from 1980 to 2021 (the date of the most recent survey). But the dominant form of home ownership remains the single-family home. It stood at 84.4% in 1980 and 84.2% in 2021[11]. Additionally, as the physical size of homes have grown, household size has shrunk. In 1980, the average household size was 2.76 people and in 2022 it was 2.50, about 10% less today[12]. This could be a reflection of family-planning efforts to compensate for the higher cost required to shelter a family in a home. On the other hand, it also means that while our home-size requirements have grown 52%, our space-per-person requirements have grown 68%[13].
So what's the overall trend here? We have a lot more people competing for space in urban regions where they demand larger homes with modestly smaller yards for their modestly smaller families. More power to them. This seems sufficient to explain the 0.23% annual growth rate of the home purchase pain index from 1980-2022. The usual culprit blamed for rising home prices is NIMBY anti-development sentiment from existing home owners and conservationist groups. While NIMBYism undeniably plays a role by constraining supply, it's the story of evolving expectations around what constitutes a home that has been largely ignored.
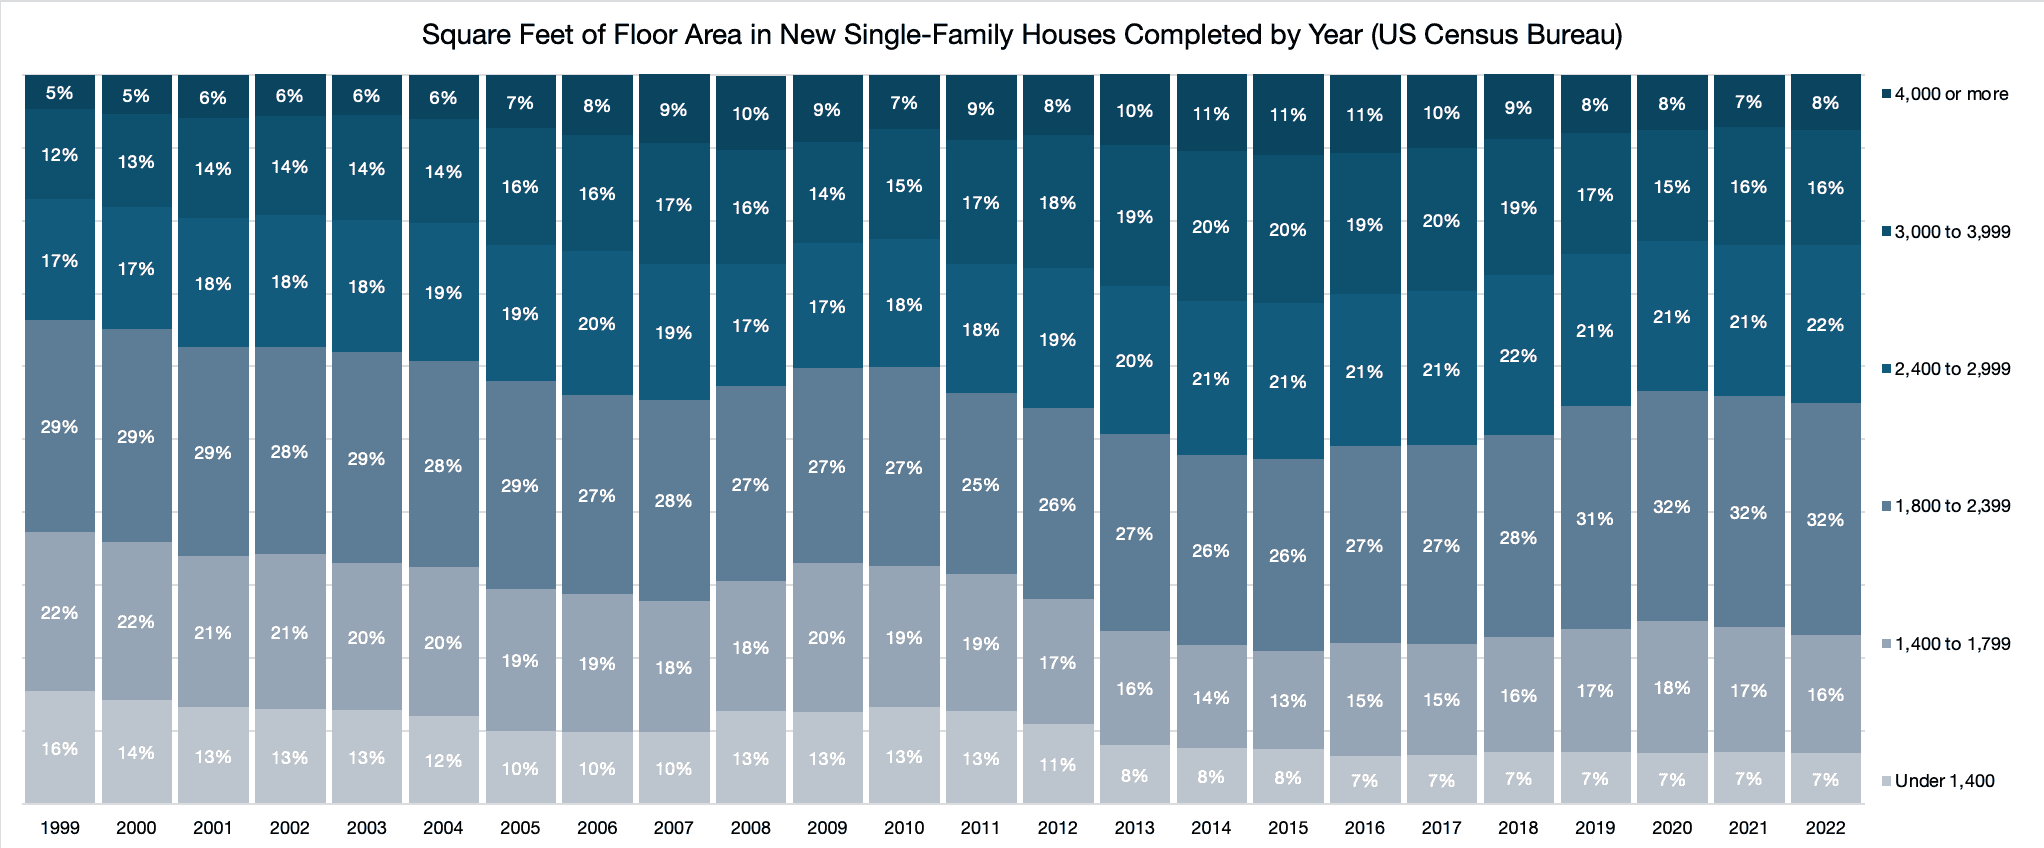
Unfortunately for the individual, there's no easy way out of this predicament by simply changing one's expectations of what they should get when they buy a home. As median home size has grown, the proportion of small homes has massively decreased. This issue is commonly referred to as the lack of "starter homes". In 1999, the U.S. Census Bureau started reporting data on the square footage distribution of new homes[14]. You can see below in Figure 2 the proportional decrease between 1999 and 2022 in new homes under 1,800 square feet. Only 23% of new homes built in 2022 were under 1800 feet. To put this in perspective, the median new home in 1980, as mentioned in the second paragraph, was 1,570 square feet. So although this Census dataset doesn't go back that far, by definition 50% of all new homes were under 1,570 square feet in 1980. And again, homes are not commodities. You buy a whole home or no home. The result is that while small homes are indeed cheaper, they generally cost more on a per square foot basis. This is especially true in popular urban areas, where the land under the home can be more valuable than the structure itself.
In the end, homes are indeed more difficult to buy than they used to be — but on average they're not truly unaffordable. They're generally nicer than the more modest abodes of our parents and grandparents, and we're paying a premium for bigger dreams in more crowded cities. The reality has been a quiet escalation of our own expectations, not a collapse in affordability.
Notes:
See Sale Price data for Single-Family Sold, SoldMedAvgSF tab
1980 is arbitrary cutoff point, chosen because it's hard to find reliable household income data going back further than 1980. That said, I believe the analysis in this post would be much more convincing if I had picked 1960 or before as my cutoff point. Another key point: In January 1983, the BLS shifted from including home prices in CPI calculations to using owners' equivalent rent, decoupling the index from direct home price inflation thereafter.
- 5.88+1⁄0.52+1 - 1 = 3.53
- 3.53⁄2.82 - 1 = 0.25
See table 01 of NHE Tables download
Healthcare spending is also not a perfect comparison as Americans are probably more over-treated today than we were in 1980. People also live longer on average and we have treatments for conditions that weren't previously treated.
See table H-9
- 3.53⁄3.21 - 1 = 0.10
It is interesting, however, that while most goods and services get cheaper with time, homes, healthcare, and college, all subsidized by the federal government have gotten more expensive with time. The US government subsidizes these sectors with cheap loans, medicare, and more cheap loans, respectively. This increases demand without directly affecting supply, so perhaps it is not that surprising that they grow more costly with time.
See Lot Size data for Single-Family Sold
In 1980, owner-occupied units numbered 52.516M, 1.998M of which were single-family attached units and 44.332M which were single-family detached (see page 1 of linked source). In 2021, owner-occupied units numbered 82.513M, 4.486M of which were single-family attached, and 69.508M which were single-family detached.
See table HH-4
- (2382 / 2.5)⁄(1570 / 276) - 1 = 0.68
- See Square Feet data for Single-Family Completed